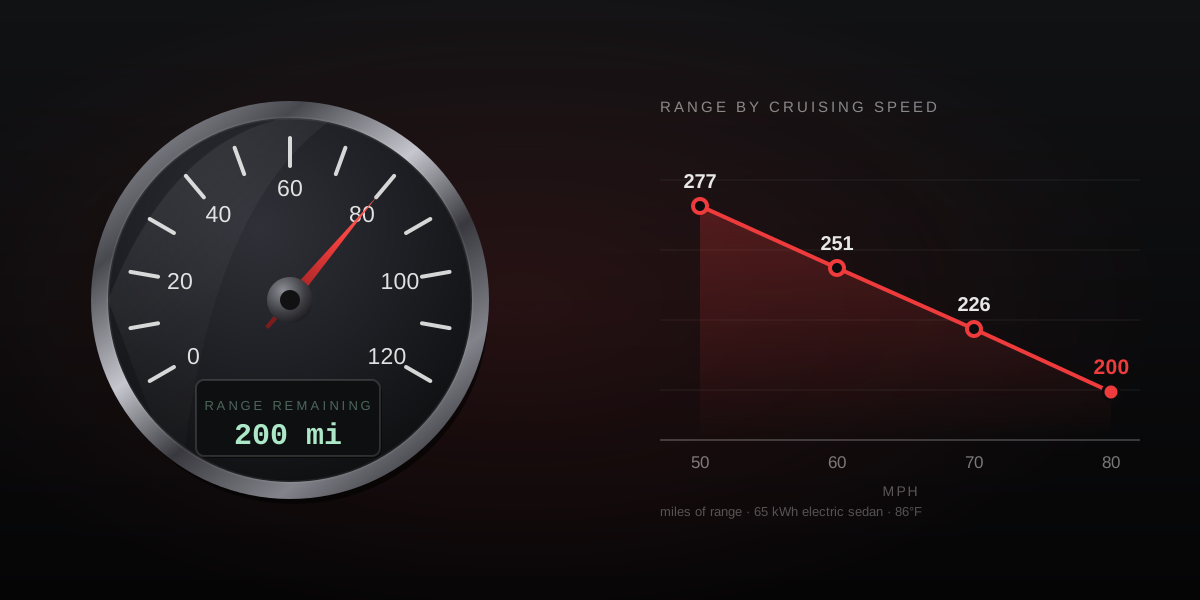
About 26 miles, for the last 10 mph alone. That is the gap between an electric sedan cruising at 70 and the same car at 80, measured across hundreds of thousands of real trips rather than a laboratory cycle. The physics behind it is simple and unforgiving, but the conclusion most people draw from it is wrong: in an electric car, driving fast is not mainly a money problem. It is a time problem.
The measured numbers
Geotab published range figures by cruising speed drawn from its fleet telematics: 350,000 trips from 500 electric sedans and 2.8 million trips from 2,000 electric vans, more than 550,000 driving hours in total. Both vehicle types carry a 65 kWh battery, and the figures below were taken at 86°F.
| Steady speed | Electric sedan | Electric van |
|---|---|---|
| 50 mph | 277 miles | 143 miles |
| 60 mph | 251 miles | 121 miles |
| 70 mph | 226 miles | 103 miles |
| 80 mph | 200 miles | 88 miles |
| Loss, 50 to 80 | 28 percent | 39 percent |
The van is the more interesting column. Same battery, same road, and it loses eleven percentage points more of its range over the same speed span. Nothing about the drivetrain explains that. The shape does: a taller, blunter body has more frontal area and a worse drag coefficient, so aerodynamics make up a larger share of its total load and the square law bites harder.
Why the square law, and why it is not the whole story
Aerodynamic drag rises with the square of speed. Because power is force multiplied by speed, the power needed to overcome drag rises with the cube. Range depends on energy per mile rather than power, and energy per mile follows the square.
Run that model naively from 70 to 80 mph and it predicts a big drop. Energy per mile should rise by the ratio of the squares, about 1.31, so 226 miles of range should fall to roughly 173.
The measured figure is 200. The model over-predicts by nearly 30 miles, and the reason is worth understanding: drag is only part of the load. Rolling resistance is roughly constant per mile regardless of speed. Cabin cooling, lights and electronics draw power on a schedule of their own. Those components dilute the square law.
The consequence is that aerodynamics is not a fixed share of your energy budget. At 50 mph it is a modest part of the total; by 80 mph it dominates every additional mile per hour. This is why the range curve steepens as you go faster rather than falling in a straight line, and why the last 10 mph always costs more than the previous 10.
Speed beats temperature, and it is not close
Cold weather gets the blame for EV range, and in winter it deserves much of it. At highway speed in warm weather it does not.
The same analysis concluded that driving speed can be the single biggest factor in range loss, and that at higher speeds in hot conditions, aerodynamic drag has a far greater effect on range than cabin cooling. The faster you drive, the less significant temperature becomes relative to the energy required simply to maintain that speed.
The asymmetry is structural. Air conditioning is close to a fixed draw: it consumes roughly the same power at 50 mph as at 80, so as a fraction of your energy per mile it actually shrinks as you speed up. Drag does the opposite. Turning the air conditioning off to save range on a hot motorway is optimising the wrong term.
The inversion petrol drivers bring with them
Anyone who has driven a combustion car for years carries a rule of thumb: highway mpg beats city mpg. It is printed on every window sticker. In an electric car that rule flips, and the flip catches people out on their first long trip.
| Combustion car | Electric car | |
|---|---|---|
| Stopped in traffic | Burning fuel at idle | Using almost nothing |
| Braking | Kinetic energy lost as heat | Much of it recovered |
| Steady 80 mph | Same drag penalty | Same drag penalty |
| Where it looks best | Highway | City |
The aerodynamics are identical between the two. What differs is the baseline they are compared against. A petrol car sets such a low bar in town that the motorway flatters it. An electric car is close to its theoretical best in town, so the motorway is where it has nowhere to hide.
This is also why a combined EPA figure misleads on a road trip. It blends a city cycle and a highway cycle, and a long fast drive is neither. The same trap catches the dashboard estimate, which is usually built from your recent driving: a week of urban commuting produces a confident, optimistic number that the first hour of motorway quietly demolishes.
Where the cost actually lands: time, not money
We worked through the petrol version of this question in is driving 80 instead of 70 worth it, where the answer came out as a fixed number of dollars per hour of time bought back. Electricity is cheap enough that the same calculation in an EV produces a small number. The real bill arrives somewhere else.
Take a 220 mile trip in the sedan above, starting full.
- At 70 mph: range is 226 miles, so the trip needs no charging stop. Driving time is about 3 h 09 m.
- At 80 mph: range falls to 200 miles, so the trip now needs a stop. Driving time drops to 2 h 45 m, but a realistic fast-charge stop of 25 minutes including leaving and rejoining the road puts arrival at about 3 h 10 m.
The faster run saved 24 minutes of driving and spent 25 minutes charging. It arrives a minute later, having used more energy and more attention to get there.
The numbers depend on the assumptions, and they should be stated: a full start, willingness to arrive with a low state of charge, and a charger conveniently placed. Change the distance and the answer changes with it. But the shape holds. Range and speed trade against each other on a curve, and charging time is a step function. Whenever a higher speed pushes you over the edge of a step, the arithmetic turns against you, and no amount of extra speed wins it back.
There is a second-order effect that makes it worse. Charging slows down markedly as the battery fills, so the last portion of a top-up is the slowest. A stop you did not need is not just an extra stop; it is disproportionately expensive in minutes.
What to do with this
The useful move is not to crawl. It is to know where the steps are on your particular route, and that means knowing your own energy per mile at a steady cruise rather than a blended sticker figure.
Getting it is straightforward. Hold one speed on a flat stretch, record the distance covered and the energy used over the same interval, and divide. Repeating it at two speeds tells you the slope of your own curve, which is the number that actually predicts a road trip.
For the distance side of that measurement, a GPS trip meter is the honest instrument. A car odometer counts wheel rotations against a stored tire circumference and typically reads 1 to 3 percent high, as we cover in is your odometer accurate, and an inflated distance quietly flatters your efficiency figure. The GPS odometer records distance independently of the car, and the live speedometer shows the true ground speed you are actually holding, which on most dashboards is a mile or two below what the needle claims.
The takeaway
An electric sedan gives up 28 percent of its range between 50 and 80 mph and a van gives up 39, because drag scales with the square of speed and body shape decides how much of the load that represents. The measured loss is gentler than a pure aerodynamic model predicts, since rolling resistance and accessories do not follow the square, but the curve steepens the faster you go and the final 10 mph is always the most expensive.
In warm weather at motorway speed, speed dominates temperature, so the air conditioning is not the thing to switch off. And because an electric car is at its best in town rather than on the open road, the instinct carried over from petrol cars points the wrong way. Most importantly, the penalty is usually paid in minutes at a charger rather than dollars at a pump, which means the fastest way to cover a long distance is often not the fastest speed.
Since holding a constant speed is the practical way to act on any of this, it is worth knowing that the usual advice about cruise control works differently in an EV, where regeneration already recovers part of what a wandering foot wastes: does cruise control save gas.